Needle Inspector — DevTools & MCP for three.js
The Needle Inspector is a powerful Chrome DevTools extension for inspecting and debugging three.js, react-three-fiber, and Needle Engine projects directly in your browser. Think of it as the browser's built-in inspector, but specifically designed for 3D scenes.

Quick Start
- Install the extension from the Chrome Web Store
- Enable the inspector by clicking the Needle icon in the browser toolbar
- Navigate to any webpage with a three.js scene
- The inspector will automatically detect the scene and appear
- Start exploring your 3D content!
Works on any three.js website
The Needle Inspector works on any website using three.js, react-three-fiber, or Needle Engine – not just your own projects. Use it to learn from other developers' work or debug production sites.


Features
Real-time Scene Inspection
The inspector gives you a complete view of your 3D scene hierarchy, similar to how the browser's Elements panel shows your HTML structure.
- Scene Hierarchy: Browse through all objects, meshes, lights, and cameras in an expandable tree view
- Search & Filter: Quickly find specific objects by name or type
- Live Updates: See changes to your scene in real-time as they happen
Property Editing
Edit any property of your 3D objects directly in the browser – no need to reload or rebuild your project. Changes can be undone with Ctrl+Z / Cmd+Z.
- Transform Controls: Adjust position, rotation, and scale with intuitive number inputs
- Material Properties: Change colors, textures, opacity, and rendering settings
- Boolean Toggles: Show/hide objects, enable/disable features
- Texture Inspection: View and analyze texture properties
All changes are applied instantly to the running scene, making it perfect for tweaking values until they look just right.
Performance Monitoring
Keep track of your scene's performance with built-in stats:
- FPS Counter: Monitor frame rate in real-time
- Scene Statistics: View object counts, triangle counts, and geometry stats
- Download Size: See estimated bandwidth usage
AI-Powered Assistance 


Connect the inspector to AI tools like Claude or Cursor for intelligent debugging and development assistance.
- MCP Integration: Exposes inspector capabilities to AI assistants
- Natural Language Queries: Ask questions about your scene
- Automated Analysis: Get suggestions for optimization and improvements
Setup is simple:
npx needle-cloud startThen connect your AI tool to explore your scene with natural language.
Learn how to connect your local AI tools: Needle MCP documentation.
Export Changes
Made some tweaks you want to keep? Export your changes for later use:
- JSON Export: Save property modifications as structured data
- Text Export: Get a readable summary of your changes
- Version Control: Perfect for sharing modifications with your team
How It Works
The Needle Inspector automatically detects three.js scenes on any webpage you visit. When a scene is found:
- An inspector panel appears showing the scene hierarchy
- Click any object to view and edit its properties
- Changes are applied immediately to the live scene
- Use the search and filter tools to navigate complex scenes
Supported Platforms
- three.js (all versions)
- react-three-fiber
- Needle Engine
- A-frame (via three.js)
- Threlte
- Any three.js-based framework
Installation
- Visit the Needle Inspector page on the Chrome Web Store
- Ensure you are using Google Chrome or a Chromium-based browser
- Click "Add to Chrome" and you're ready to go!
Usage Tips
Toggle the inspector
Click the Needle Inspector extension icon to show or hide the inspector panel at any time.
Inspect in isolation
Right-click any object in the hierarchy and select "Inspect" to view it in an isolated 3D view, making it easier to focus on specific parts of your scene.
Use Cases
Development & Debugging
- Quickly test different property values without recompiling
- Debug complex scene hierarchies
- Identify performance bottlenecks
Learning & Exploration
- Inspect how other developers build their scenes
- Understand three.js best practices by examining production sites
- Learn new techniques by exploring example projects
Optimization
- Monitor performance metrics
- Identify heavy objects or excessive geometry
- Test optimization strategies in real-time
Screenshots
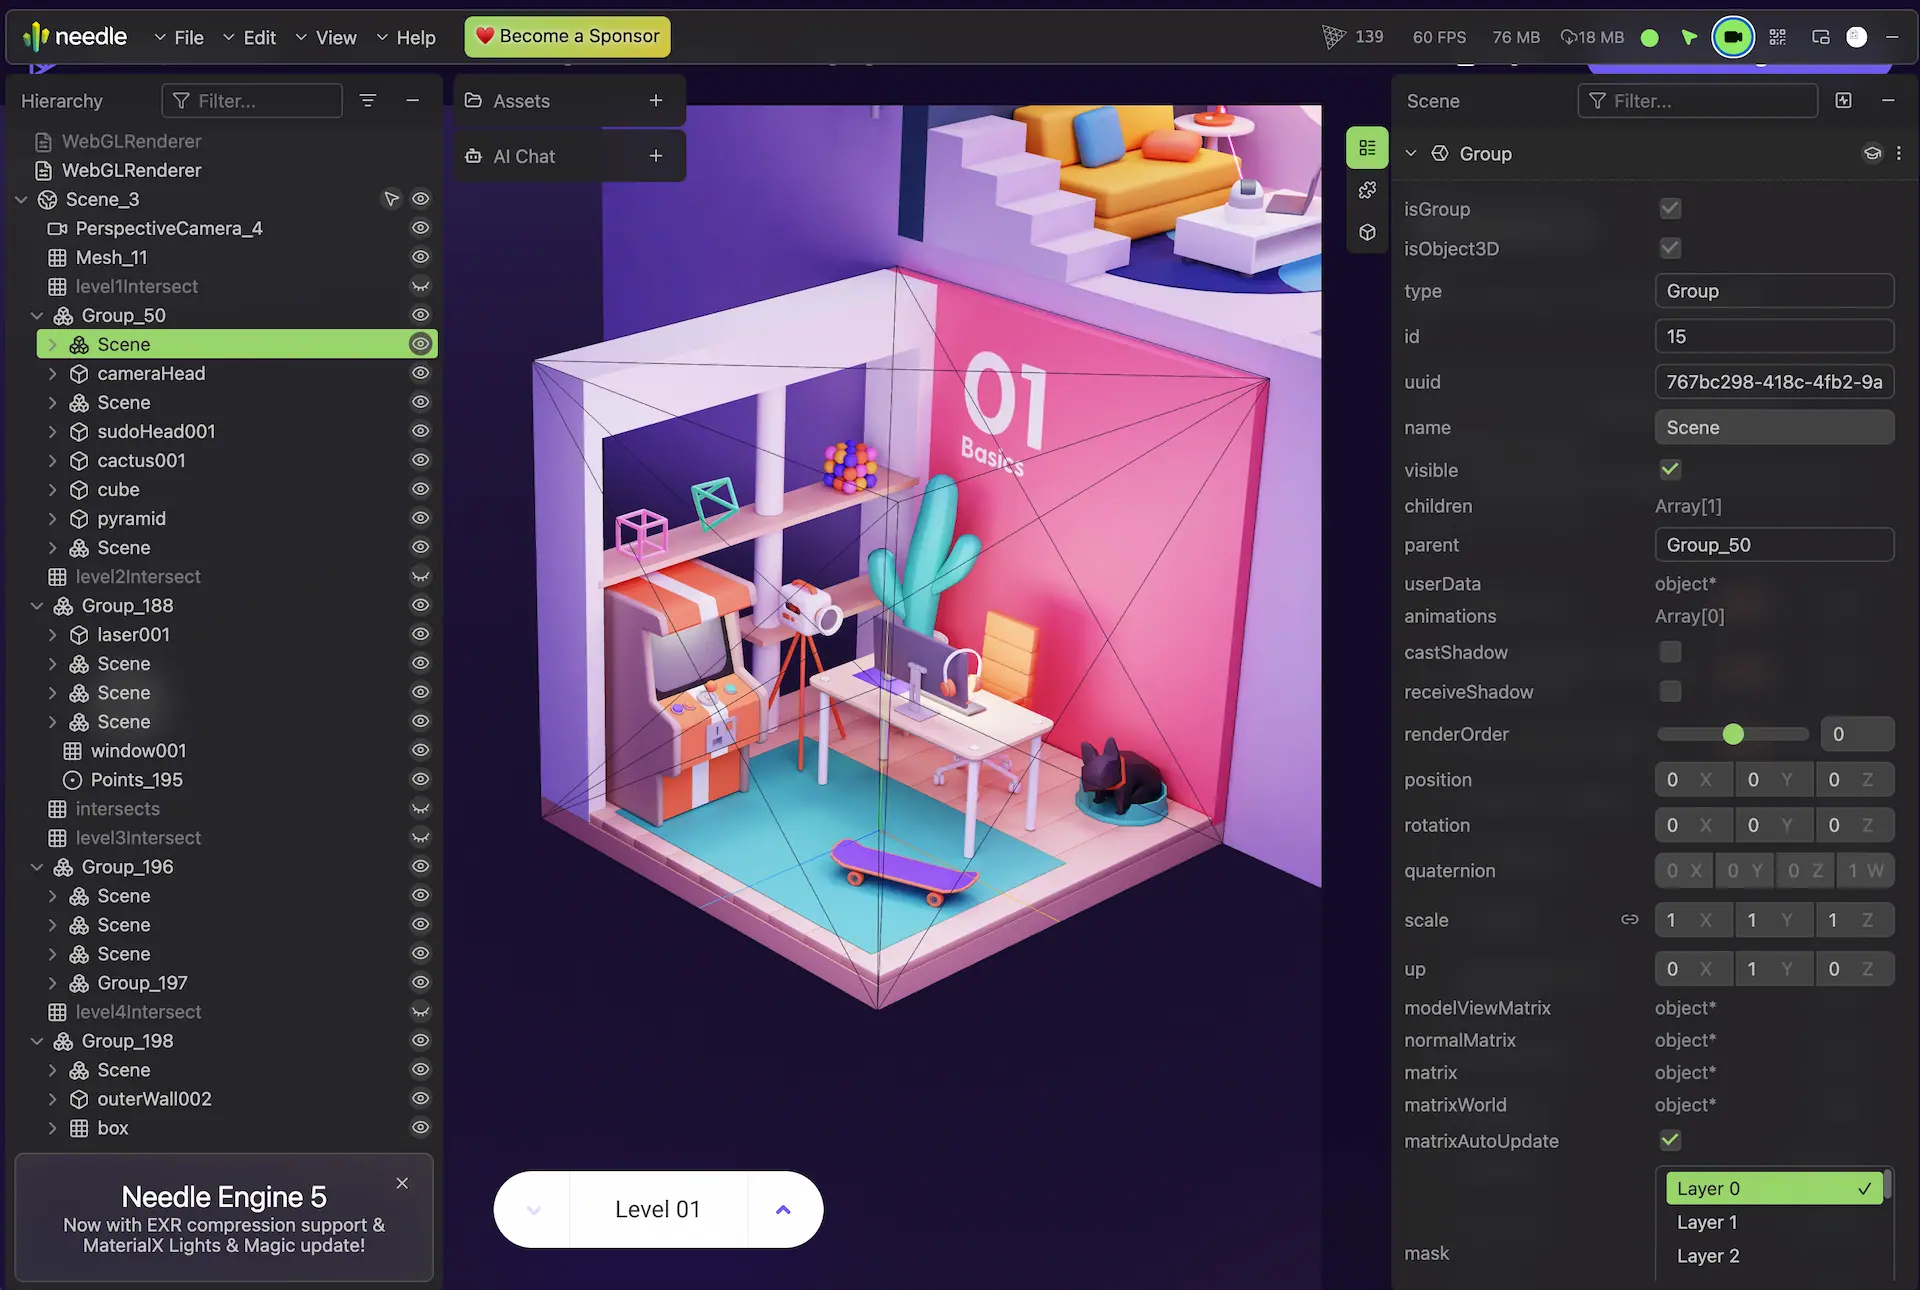 . Needle Inspector is a great tool for learning
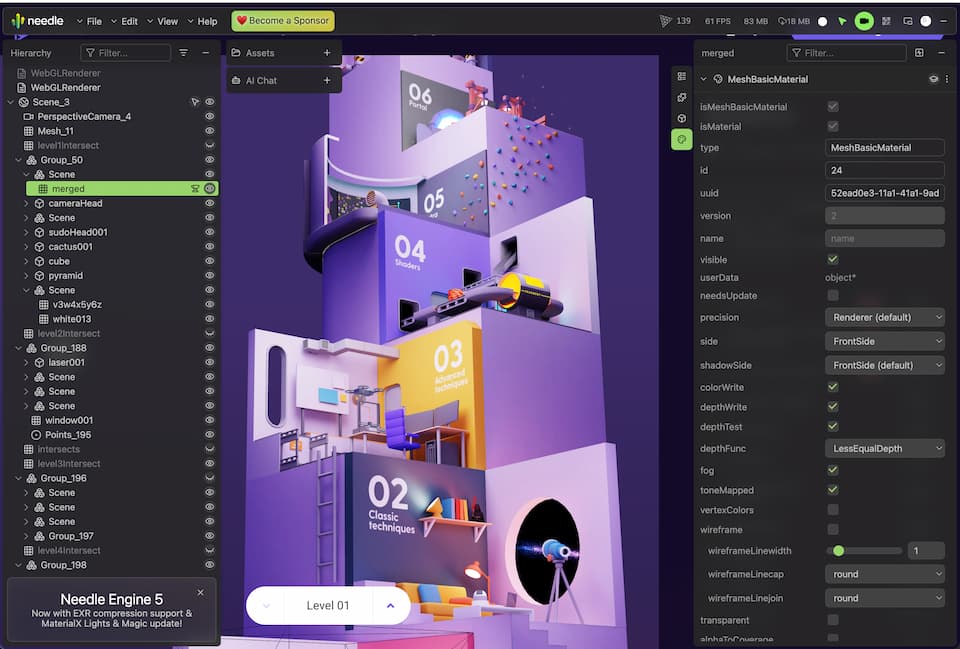 . You can even explore behind the scenes 😏
What Users Say


Next Steps
- Learn about Needle Engine
- Explore three.js integration
- Get started with Needle in Unity
- Get started with Needle in Blender
- AI-Powered Development - Connect AI assistants to the inspector
Using Needle Engine?
The inspector has special features when used with Needle Engine projects, including component editing, networking inspection, and XR debugging tools.